Note
Click here to download the full example code
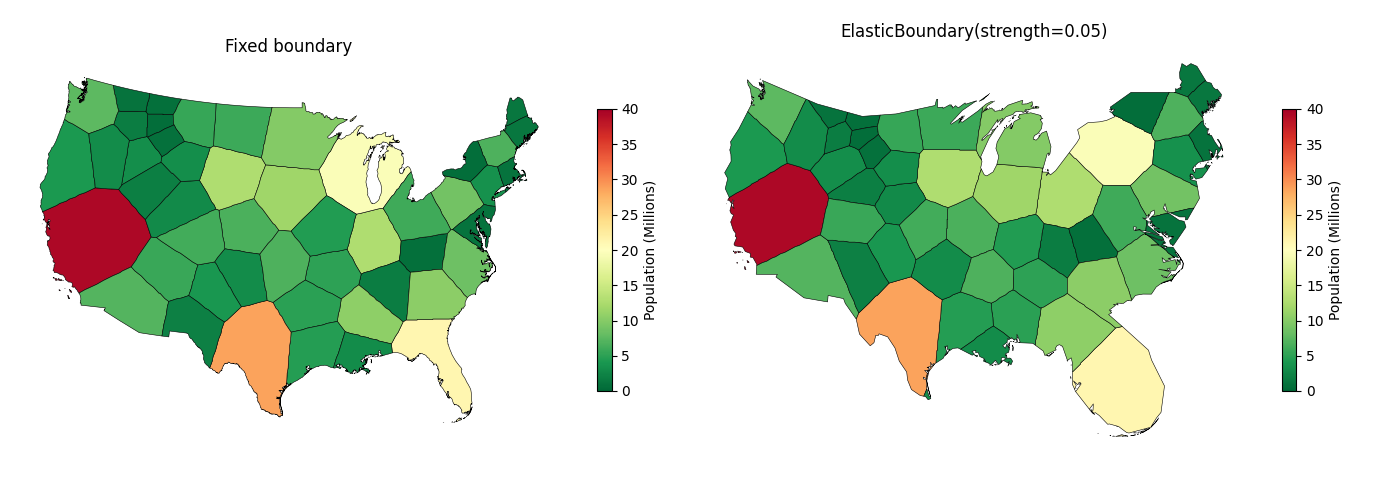
Voronoi Cartogram with Elastic Boundary
Population cartogram of US States where the outer boundary deforms to reduce area errors at the periphery.
Load dataset and run with a fixed boundary (left) and elastic boundary (right).
import matplotlib

matplotlib.use("Agg")
import matplotlib.pyplot as plt

import carto_flow.data as examples
import carto_flow.voronoi_cartogram as vor

us_states = examples.load_us_census(population=True)

opts = vor.VoronoiOptions(n_iter=300, area_cv_tol=0.05)

result_fixed = vor.create_voronoi_cartogram(
    us_states,
    weights="Population (Millions)",
    backend=vor.RasterBackend(resolution=256, boundary=None),
    options=opts,
)

result_elastic = vor.create_voronoi_cartogram(
    us_states,
    weights="Population (Millions)",
    backend=vor.RasterBackend(resolution=256, boundary=vor.ElasticBoundary(strength=0.05)),
    options=opts,
)
Plot the two results side by side.
fig, axes = plt.subplots(1, 2, figsize=(14, 5))
for ax, res, title in zip(
    axes,
    [result_fixed, result_elastic],
    ["Fixed boundary", "ElasticBoundary(strength=0.05)"],
    strict=False,
):
    res.plot(
        "Population (Millions)",
        ax=ax,
        cmap="RdYlGn_r",
        vmin=0,
        vmax=40,
        legend=True,
        legend_kwds={"shrink": 0.6, "label": "Population (Millions)"},
    )
    ax.set(title=title)
    ax.axis("off")
plt.tight_layout()
Total running time of the script: ( 0 minutes 3.915 seconds)
Download Python source code: plot_voronoi_elastic_boundary.py
Download Jupyter notebook: plot_voronoi_elastic_boundary.ipynb