Note
Click here to download the full example code
Mosaic Tilegram
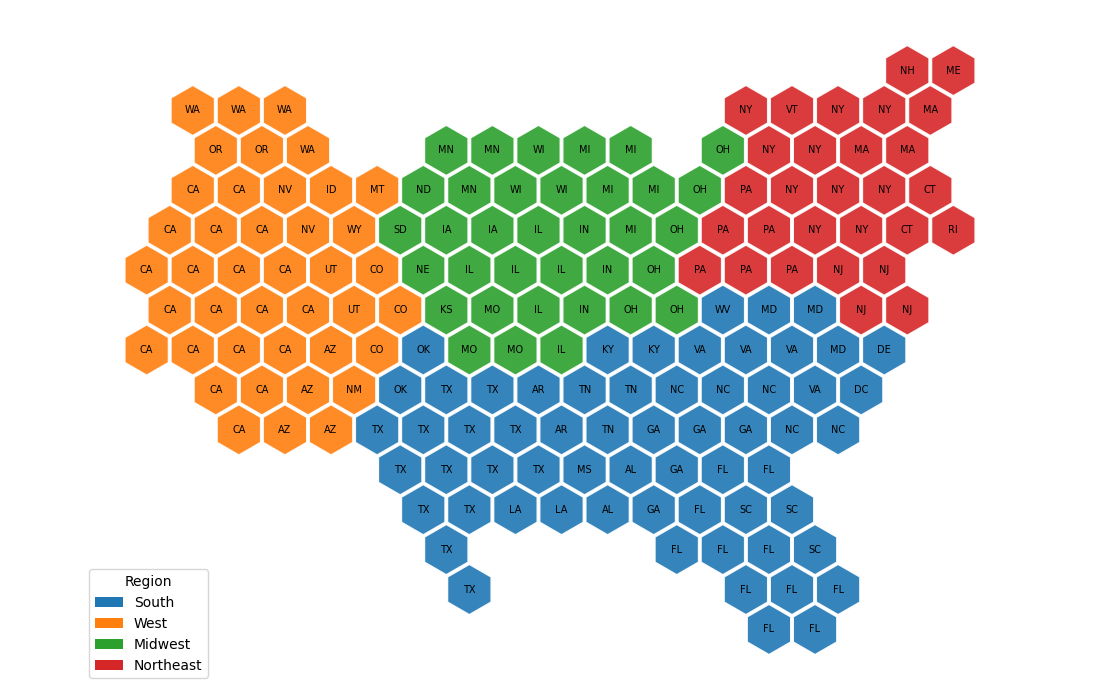
A tilegram of the US states, where every state is drawn as a block of hexagons and the number of hexagons is fixed by a data column.
MosaicLayout gives each region exactly its requested number of tiles
from one shared lattice, and keeps those tiles together as a single
connected block, so the block shapes read as the states themselves rather
than as scattered symbols.
Load the states and derive a tile count.
One tile stands for two million people, with a floor of one tile so the smallest states stay on the map.
import matplotlib

matplotlib.use("Agg")
import matplotlib.pyplot as plt

import carto_flow.data as examples
import carto_flow.symbol_cartogram as smb

us_states = examples.load_us_census(population=True)
us_states["Tiles"] = (us_states["Population"] / 2e6).round().clip(lower=1).astype(int)
Build the tilegram.
tile_count names the column with the per-region tile counts, and
spacing opens a small gap between neighboring hexagons.
symbol_carto = smb.create_symbol_cartogram(
    us_states,
    tile_count="Tiles",
    layout=smb.MosaicLayout(spacing=0.06),
    show_progress=False,
)
Plot the result.
Each hexagon carries the abbreviation of the state it belongs to, and the fill color is the state's census region. The familiar outline of the country survives, with the populous coasts taking many more tiles than their land area would suggest; the sparsely populated mountain states shrink to one or two tiles each.
fig, ax = plt.subplots(1, 1, figsize=(11, 7))

_ = symbol_carto.plot(
    ax=ax,
    column="Region",
    edgecolor="white",
    linewidth=1.0,
    label="State Abbreviation",
    label_fontsize=7,
    legend_kwds={"loc": "lower left", "title": "Region"},
)

ax.set_axis_off()
plt.tight_layout()
Total running time of the script: ( 0 minutes 1.048 seconds)
Download Python source code: plot_symbol_mosaic_layout.py