Note
Click here to download the full example code
Voronoi Districts
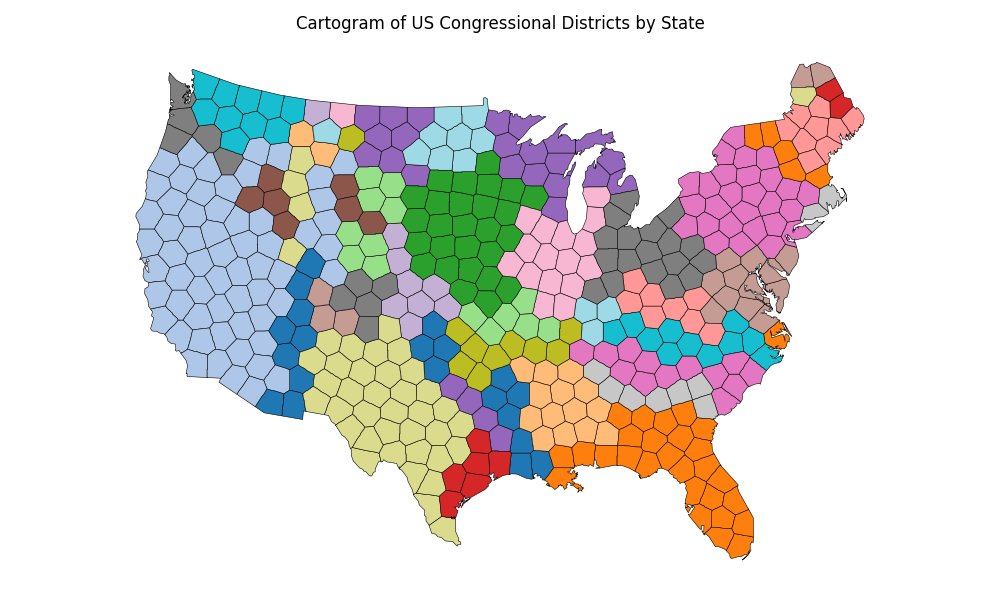
A Voronoi tesselation cartogram of US Congressional Districts.
Uses carto_flow.voronoi_cartogram.create_voronoi_cartogram.
Load dataset and run the morphing algorithm.
import matplotlib

matplotlib.use("Agg")
import matplotlib.pyplot as plt

import carto_flow.data as examples
import carto_flow.voronoi_cartogram as vor
from carto_flow.geo_utils.simplification import simplify_coverage

us_districts = examples.load_us_census(population=True, level="congressional_district")
us_districts = simplify_coverage(us_districts, tolerance=1000, min_island_size=50000)

# compute Voronoi cartogram
result = vor.create_voronoi_cartogram(
    us_districts,
    backend=vor.RasterBackend(resolution=512, boundary=vor.ElasticBoundary(0.02)),
    options=vor.VoronoiOptions(n_iter=300, area_cv_tol=0.1, tol=2500),
    group_by="State Name",
)

# attempt to fix group contiguity issues
result = result.repair_topology("State Name").cartogram
Plot the cartogram.
_, ax = plt.subplots(1, 1, figsize=(10, 6))

p = result.plot(
    "State Name",
    ax=ax,
    cmap="tab20",
    show_edges=True,
)

p.ax.set(title="Cartogram of US Congressional Districts by State")
p.ax.axis("off")

plt.tight_layout()
Total running time of the script: ( 0 minutes 9.613 seconds)
Download Python source code: plot_voronoi_districts.py