Note
Click here to download the full example code
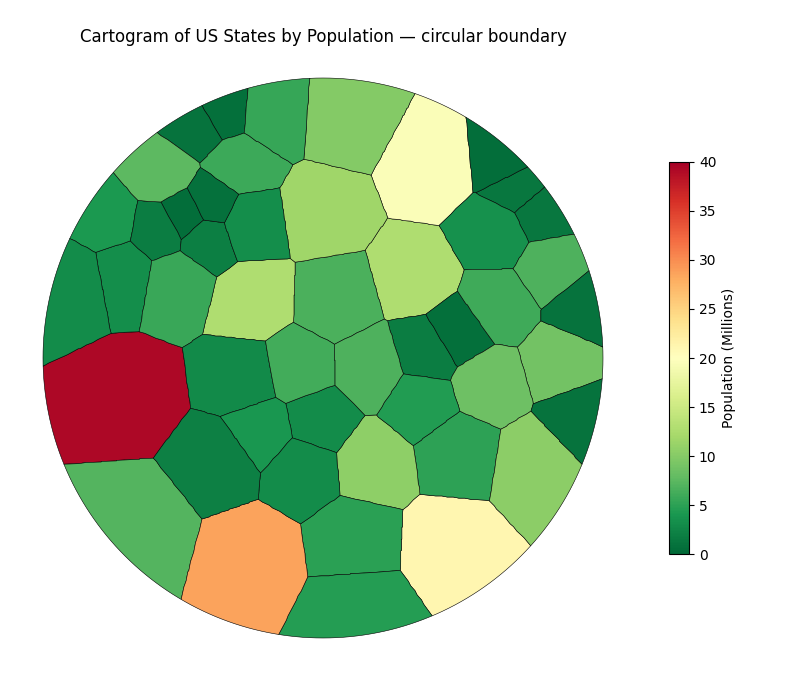
Circular Voronoi Cartogram
Population cartogram of US States fitted inside a custom circular boundary.
Build a circular boundary and run the cartogram inside it.
import matplotlib

matplotlib.use("Agg")
import matplotlib.pyplot as plt

import carto_flow.data as examples
import carto_flow.voronoi_cartogram as vor

us_states = examples.load_us_census(population=True)

result = vor.create_voronoi_cartogram(
    us_states,
    weights="Population (Millions)",
    boundary="circle",
    backend=vor.RasterBackend(resolution=256),
    options=vor.VoronoiOptions(n_iter=300, area_cv_tol=0.05),
)
Out:
/home/runner/work/carto-flow/carto-flow/.venv/lib/python3.12/site-packages/shapely/decorators.py:173: DeprecationWarning: The 'resolution' argument is deprecated. Use 'quad_segs' instead
  result = func(*args, **kwargs)
Plot the cartogram.
fig, ax = plt.subplots(figsize=(8, 7))
result.plot(
    "Population (Millions)",
    ax=ax,
    cmap="RdYlGn_r",
    vmin=0,
    vmax=40,
    legend=True,
    legend_kwds={"shrink": 0.6, "label": "Population (Millions)"},
)
ax.set(title="Cartogram of US States by Population — circular boundary")
ax.axis("off")
plt.tight_layout()
Total running time of the script: ( 0 minutes 1.835 seconds)
Download Python source code: plot_voronoi_custom_boundary.py
Download Jupyter notebook: plot_voronoi_custom_boundary.ipynb