Note
Click here to download the full example code
Voronoi Cartogram
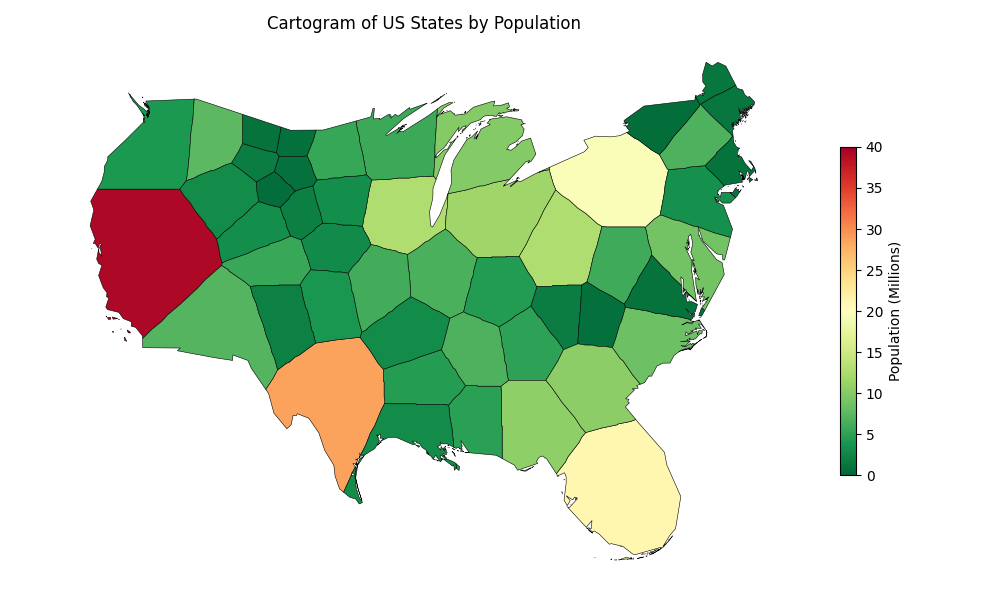
A Voronoi tesselation cartogram where US States are represented
by Voronoi cells whose areas are proportional to population.
Uses carto_flow.voronoi_cartogram.create_voronoi_cartogram.
Load dataset and run the morphing algorithm.
import matplotlib

matplotlib.use("Agg")
import matplotlib.pyplot as plt

import carto_flow.data as examples
import carto_flow.voronoi_cartogram as vor

us_states = examples.load_us_census(population=True)

# compute Voronoi cartogram
result = vor.create_voronoi_cartogram(
    us_states,
    weights="Population",
    backend=vor.RasterBackend(resolution=256, boundary=vor.ElasticBoundary(strength=0.02), adjacency_spring=0.2),
    options=vor.VoronoiOptions(n_iter=100, show_progress=False),
)
Plot the cartogram.
_, ax = plt.subplots(1, 1, figsize=(10, 6))

p = result.plot(
    "Population (Millions)",
    ax=ax,
    vmin=0,
    vmax=40,
    legend=True,
    legend_kwds={"shrink": 0.6, "label": "Population (Millions)"},
    cmap="RdYlGn_r",
    show_edges=True,
)

p.ax.set(title="Cartogram of US States by Population")
p.ax.axis("off")

plt.tight_layout()
Total running time of the script: ( 0 minutes 5.934 seconds)
Download Python source code: plot_voronoi_cartogram.py