Note
Click here to download the full example code
Mosaic Tilegram of Grouped Regions
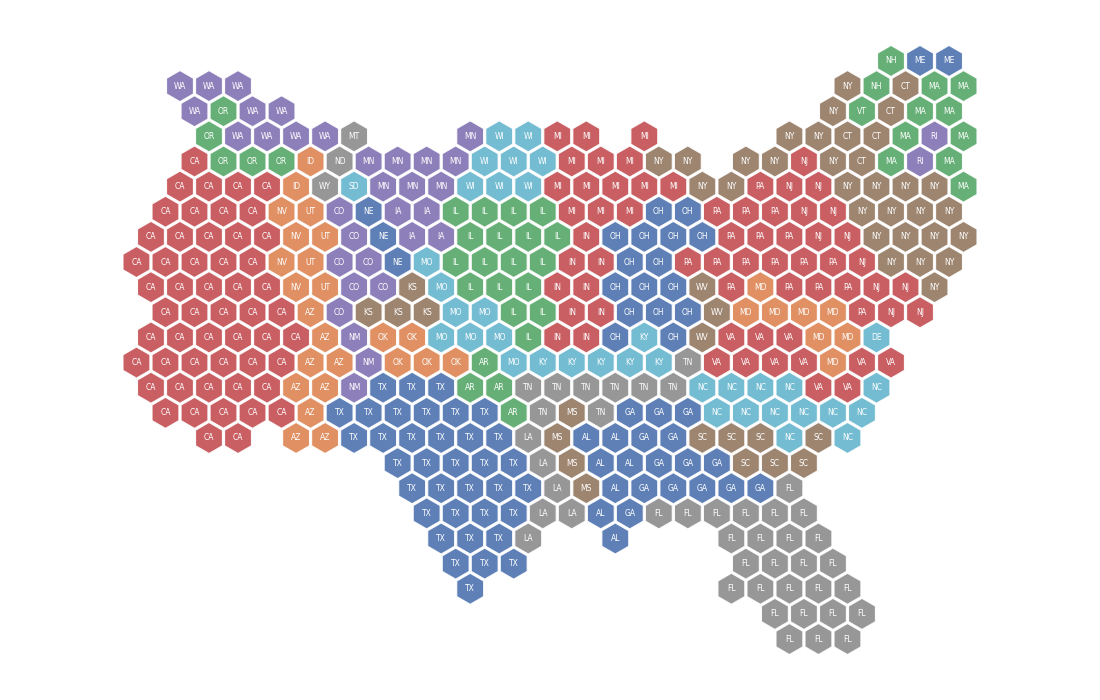
One hexagon per US congressional district, with the districts of a state held together as a single connected block.
group_by names the column that defines the blocks. MosaicLayout
then keeps every group's tiles contiguous as well as every region's, so the
states remain readable even though each state is drawn only as a cluster of
its own districts.
Load the congressional districts.
With no tile_count column, every region receives exactly one tile, so
the map holds one hexagon per district.
import matplotlib

matplotlib.use("Agg")
import matplotlib.pyplot as plt

import carto_flow.data as examples
import carto_flow.symbol_cartogram as smb

districts = examples.load_us_census(population=True, level="congressional_district")
Give each state a fill color.
The colors cycle through a short palette in alphabetical order of state name; they carry no meaning beyond making the block of each state visible against its neighbors.
palette = ["#4c72b0", "#dd8452", "#55a868", "#c44e52", "#8172b3", "#937860", "#64b5cd", "#8c8c8c"]
state_names = sorted(districts["State Name"].unique())
districts["Color band"] = districts["State Name"].map({
    name: f"band {i % len(palette)}" for i, name in enumerate(state_names)
})
color_map = {f"band {i}": color for i, color in enumerate(palette)}
Build the tilegram, grouping the districts by state.
symbol_carto = smb.create_symbol_cartogram(
    districts,
    group_by="State Name",
    layout=smb.MosaicLayout(spacing=0.08),
    show_progress=False,
)
Plot the result.
No state's districts are split across the map: each state's tiles form one connected patch of color, in roughly the place and with roughly the shape the state has on the ground. The number of hexagons in a patch is that state's district count, so patch size tracks population rather than area.
A few lattice cells inside the outline are left empty and read as small
holes, with the same number of tiles taken from just outside the outline
instead; cells that could only be filled by breaking a state's block stay
unassigned. Tiles that look detached, such as Michigan's northern one, are
neighbors on the lattice: the gap between them is only the spacing
the symbols are drawn with.
fig, ax = plt.subplots(1, 1, figsize=(11, 7))

_ = symbol_carto.plot(
    ax=ax,
    facecolor="Color band",
    cmap=color_map,
    edgecolor="white",
    linewidth=0.8,
    label="State Abbreviation",
    label_fontsize=5.5,
    label_color="w",
    legend=False,
)

ax.set_axis_off()
plt.tight_layout()
Total running time of the script: ( 0 minutes 2.965 seconds)
Download Python source code: plot_symbol_mosaic_groups.py